One of my favorite things about the end of the year is the release of Spotify Wrapped. It's fun to discover how much did I actually like Taylor Swift's latest album (a lot) and quantify it with real data. However, you don't really have to wait until the end of the year to get such information.
The Two Ways to Get Your Spotify Data
In general, there are two ways to access your personal Spotify data. The first is through the Spotify API, which powers sites like Replayify and How Bad is Your Spotify. While the Spotify API provides a lot of useful data, it doesn't necessarily provide the same level of detail as Spotify Wrapped. The API is primarily focused on providing real-time data to developers to interact with Spotify.
For example, the Spotify API can tell you who your top artist is, but it doesn't give you information about how many times you've listened to a particular song or how many minutes you've spent listening to a certain artist. Additionally, the data provided by the API is limited to a certain time frame, usually the last 50 tracks played or the current user's top artists and tracks for the last four weeks or six months.
The second way is to just download your data from your account page. Spotify will compile your data in less than three days, and then you can download the zip file.
Preparing the Data
The zip file contains multiple JSON files, with your streaming history split across them (if you don't listen to Spotify as much, then you might only get 1 JSON file). I found it to be easier to merge the files and convert it to CSV with Python before analysing it.
import pathlib
import pandas as pd

year = 2022

def main():
    json_folder = f"jsons{year}"

    # Get all JSON files and save as dataframes
    paths = pathlib.Path(json_folder).glob('*.json')
    json_file_paths = [x for x in paths if x.is_file()]
    dfs = [pd.read_json(fname) for fname in json_file_paths]

    df = pd.concat(dfs)
    df['endTime'] = pd.to_datetime(df['endTime']) # Safely convert to datetime
    df.to_csv(f"{json_folder}/StreamingHistoryAll{year}.csv", index=False)

main()
Unwrapping Your Spotify Data in Data Studio
With the downloaded data, you can recreate your own Spotify Wrapped in your data visualisation platform of choice – mine was Data Studio, because it's free. By exploring your Spotify data on Data Studio, you can create visualizations that show your top artists, songs, and genres, as well as other interesting data like the total number of minutes you spent listening to Spotify throughout the year.
And since you have total control over it, you can further analyse it by breaking your data down into months, days and even visualise it by the hour.
Results
My personal favourite additional visualisation is the heatmap of my listening schedule (credits to my friend, Emir, who did it on PowerBI). It's fascinating to see how my music consumption changes throughout the day and week. I learned that I listen to a lot of music while working. Well, I always kinda knew that but now I have proof. It's interesting to see how my music habits reflect my daily routine and activities. The heatmap is a great visual representation of how music is intertwined with our lives and routines.
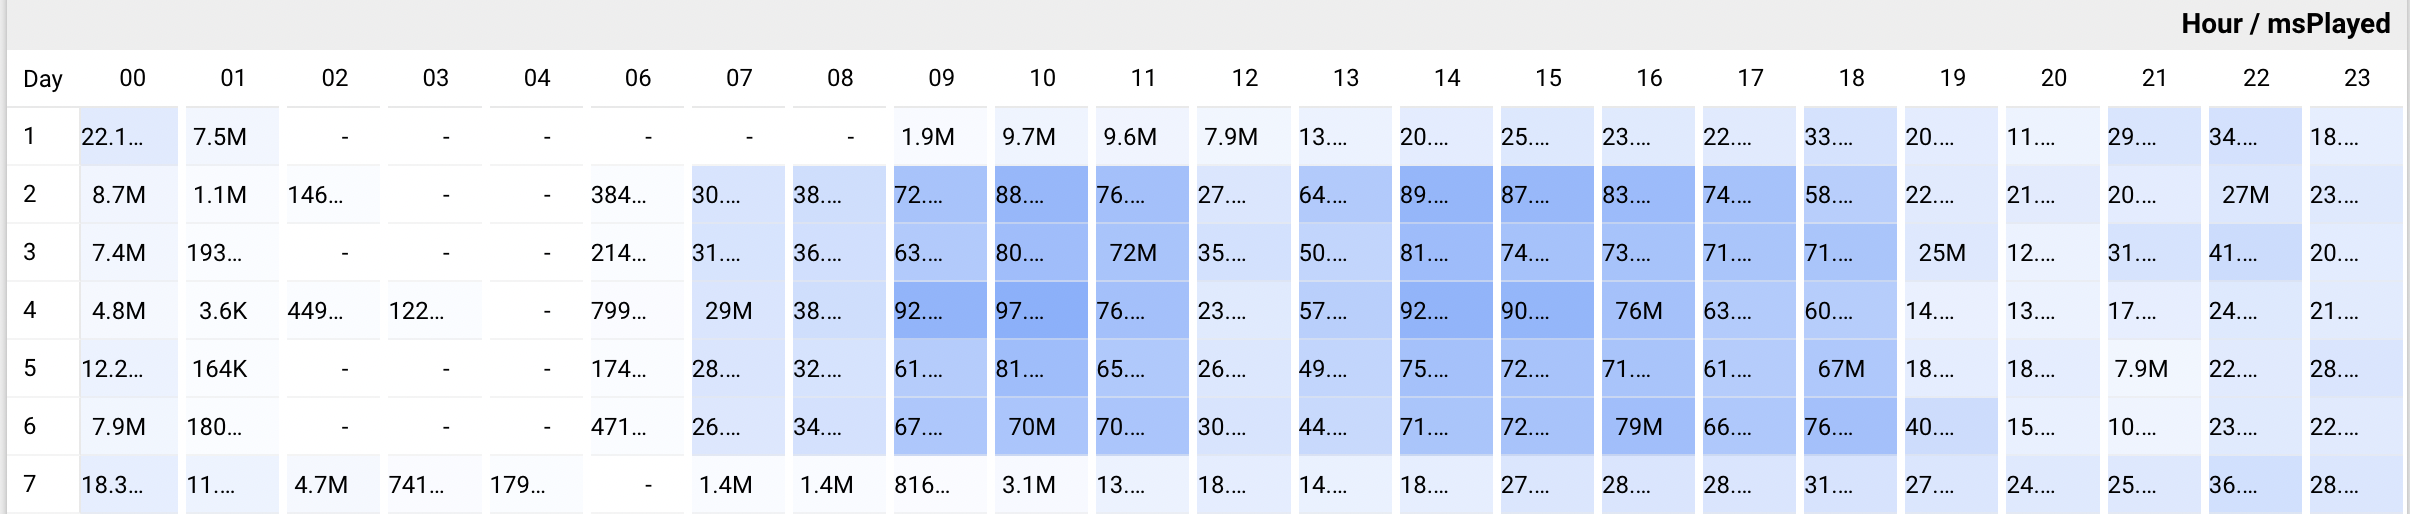
Guess my working hours and my lunch hour
It's interesting to compare your DIY data visualization to Spotify Wrapped's results. Of course, due to the unclear cut-off time frame that Spotify uses for data collection, it's impossible to replicate the exact same outcome. Also, what metrics does Spotify use to determine your Top Artist or Top Song? Is it based on the number of times you played it, or the total amount of minutes you spent listening to it? The former would favour shorter songs, while the latter could include songs that randomly played during your shuffle and were skipped after less than a minute.
Regardless of the exact metrics used, ultimately they're just fun ways to reflect on our music listening habits (and a good reason to learn how to use Data Studio).
Feel free to create a copy of the template and add your own data source to it
Note: I am only willing to share my data from 2020. All the years after that are too embarassing 😅 I've also limited the tables to only show 10-25 results by disabling pagination. You can re-enable pagination on your own data to get a complete view of it.